Managing sales can be a daunting task, especially when you’re running a digital product business. A well-organized sales tracker can make your life a lot easier. Google Sheets is a fantastic, free tool that you can use.
Why Use Google Sheets for Tracking Sales?
Google Sheets is free, easy to use, and accessible from anywhere with an internet connection. It’s perfect for customizing a sales tracker that meets your unique needs, whether you’re selling e-books, courses, templates, or software.
Step 1: Set Up Your Sales Tracker Sheet
Open Google Sheets and create a new spreadsheet. Rename the file to something easy to recognize, like Digital Product Sales Tracker.

Create these column headers in the first row:
- Date
- Product Name
- Units Sold
- Price Per Unit
- Total Revenue
- Platform (e.g., Shopify, Etsy, Gumroad)
- Customer Notes
These columns will help you organize and filter your data later.

Step 2: Add Formulas for Calculations
Once your table is all set, you can now enter the information needed for each field.

In the Total Revenue column, you’ll want to automate the math. Use a formula to calculate revenue for each sale. Here’s how:
Click the first empty cell under Total Revenue. Enter this formula: =D10*E10.

This multiplies the number of units sold by the price per unit. Drag the formula down the column to apply it to future rows.
Step 3: Include Drop-Down Menus for Platforms
To keep things consistent, create a drop-down menu for the Platform column.
Highlight the cells under the Platform header. Click on Insert > Dropdown. In the options, add platforms like Shopify, Etsy, Gumroad, or others you use.

Save your settings, and now you can select from a list instead of typing each time.
Step 4: Summarize Data with a Dashboard
A summary dashboard gives you a quick view of your performance. Use another sheet in the same file to create:
Total Sales: Sum up the Total Revenue column with =SUM(Total Revenue Range).

Use similar =SUM function to get the total unit sold.
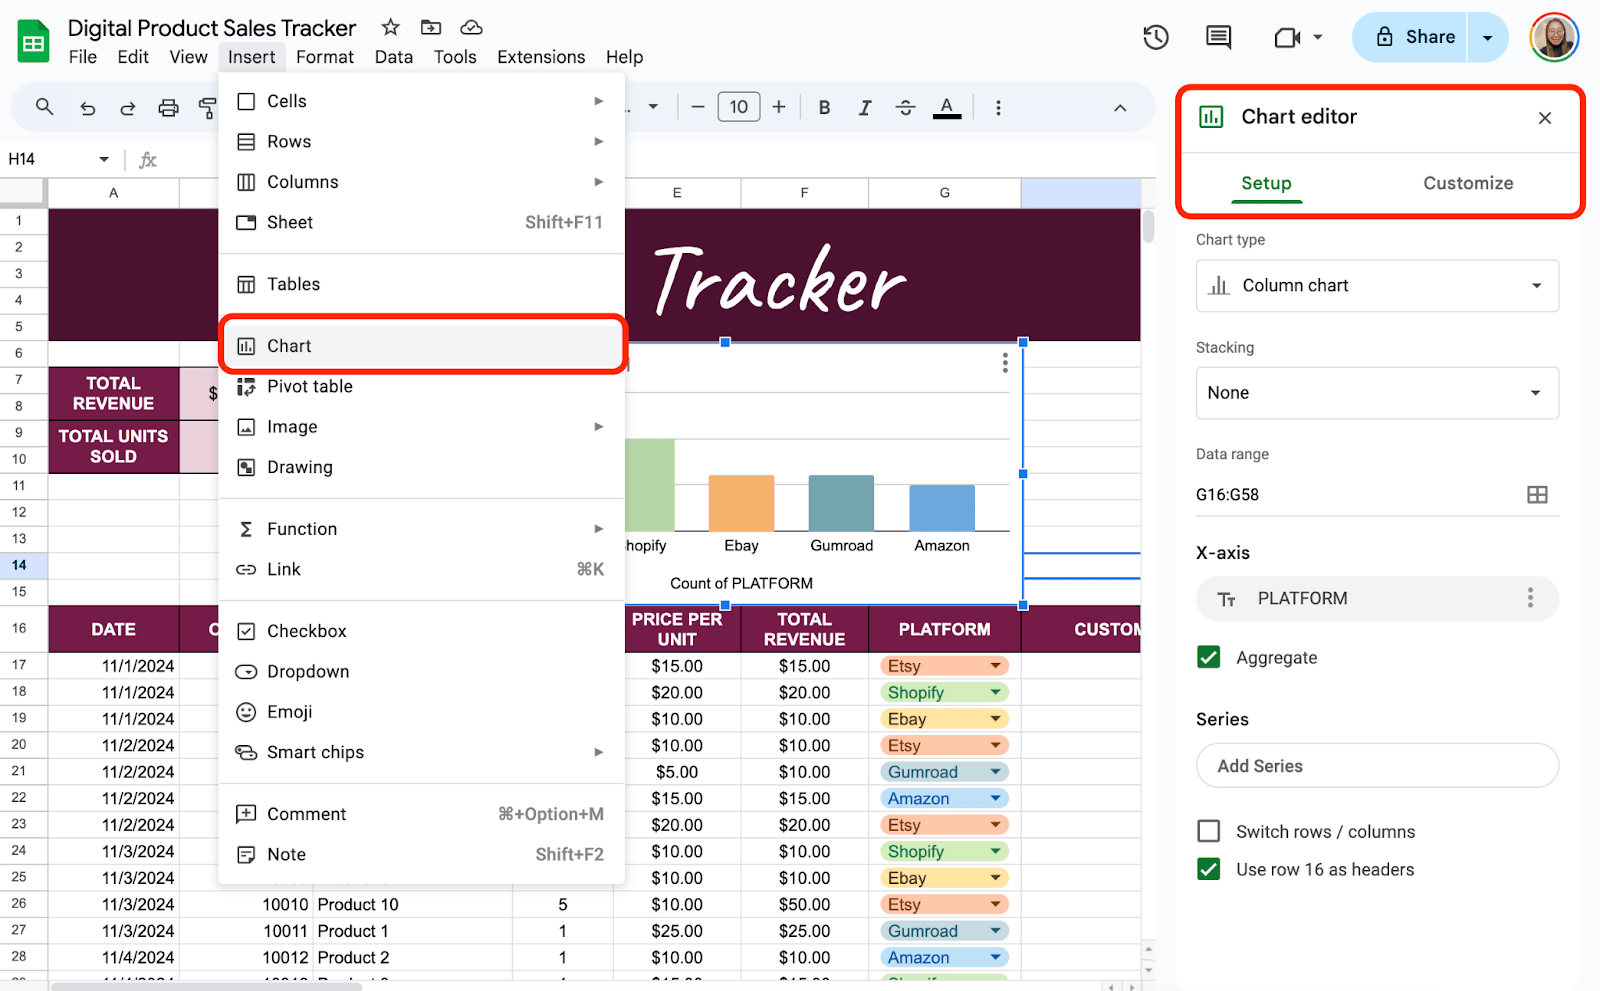
Monthly Sales Trends: To insert a chart showing which platform has the highest revenue over time, select your platform columns and click Insert > Chart.
If you work with a team, share your tracker through Google Sheets. Use the Share button in the top-right corner to grant view or edit access. This is especially useful for transparency with partners or assistants.

Get the Free Sales Tracker Template
Get a copy of the free Sales Tracker Template. I’ve populated some cells as examples, but you can customize them as needed.
Final Thoughts
A sales tracker is more than just a spreadsheet—it’s a window into your business’s potential. As you build and use your tracker, remember that it doesn’t have to be perfect from the start. Focus on creating something that works for you. Over time, you can refine it to fit your workflow and goals better.
Frequently Asked Questions
What formula do I use to calculate Total Sales?
In the Total Sales column, use the formula: =C2*D2. Here, C2 is the cell for Sale Price, and D2 is the cell for Quantity Sold. Adjust the cell references based on your actual column letters and row numbers.
Can I calculate the average sale price? How?
Yes, you can calculate the average sale price using: =AVERAGE(C:C). This formula takes the average of all values in the Sale Price column.
Can I track expenses and profits along with sales?
Absolutely! Add columns for expenses (like marketing costs or platform fees) and calculate your profits using a formula like Total Revenue – Expenses. This gives you a clearer picture of your overall business performance.
The Bottom Line:
One keeps you awake. The other gets work done.
A month of coffee: $150
A month of FileDrop: $19
Why not have both?

