Do you feel overwhelmed by managing your investments, like stocks, mutual funds, or cryptocurrencies? Google Sheets can make it easier. You can streamline the entire process using Google Sheets as a portfolio tracker.
One feature that stands out is data validation. It helps you keep everything organized and ensures that your entries are consistent and accurate. With that kind of clarity, you can feel more at ease as you keep an eye on your investments.
What Is an Investment Portfolio?
An investment portfolio is basically a mix of different assets, like stocks, bonds, mutual funds, or even real estate and art. The goal is to grow your money while managing the risks based on what works best for you and your financial goals. A smart way to do this is through diversification, which means spreading your investments around. This helps reduce risk and keeps things more balanced, so you’re not putting all your eggs in one basket and can aim for more steady returns.
Step 1: Set Up Your Spreadsheet
Open Google Sheets and start by creating a new spreadsheet. Label the first row with categories that will help organize your investment data. Some useful headings include:
- Investment Type
- Ticker Symbol
- Purchase Date
- Shares Owned
- Purchase Price
- Current Price
- Total Value
- Profit/Loss
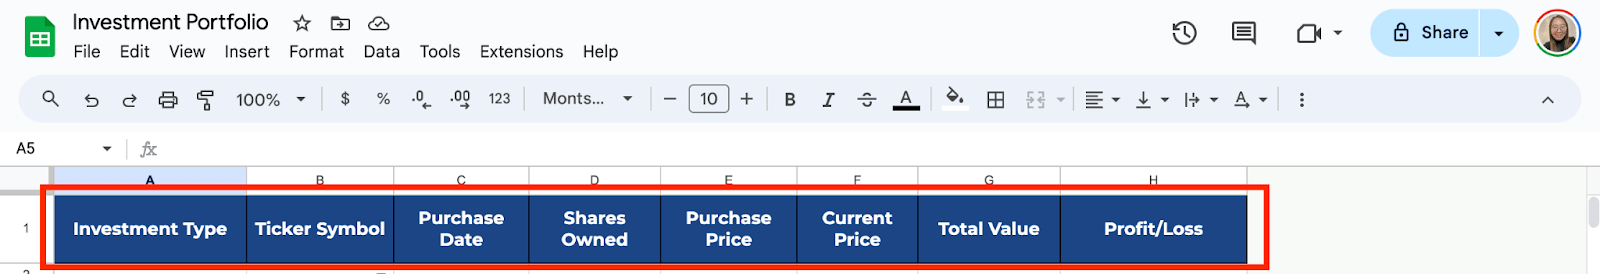
This layout helps you track all the important details of your investments in one place.
Step 2: Add Data Validation to Ticker Symbols
Now, you’ll want to ensure that the ticker symbols entered are valid and consistent. Data validation can help with this.
Select the column where you will enter the ticker symbols. Go to Data in the menu and click on Data Validation. Under Criteria, choose Dropdown. It allows you to create a list of acceptable ticker symbols.
For example, you could enter symbols like AAPL, GOOGL, AMZN, and any others relevant to your portfolio. Click Save.

It will ensure you only enter valid ticker symbols, avoiding mistakes or typos.
Step 3: Set Up Dropdowns for Investment Types
If you invest in multiple types of assets, such as stocks, bonds, or cryptocurrencies, it’s helpful to categorize them using a dropdown menu.
Select the column where you want to list the type of investment. Go to Data, then Data Validation. In the Criteria box, choose Dropdown and enter your categories: Stock, Mutual Fund, ETF, and Crypto. Save the validation.

You can quickly choose from your pre-defined categories when entering new investments.
Step 4: Automate Calculations for Total Value and Profit/Loss
Now that your data validation is in place, you can automate more tedious calculations like total value and profit or loss.
In the Total Value column, you can calculate the value of your investment by multiplying the number of shares owned by the current price.
In the Total Value column, enter the formula:
=D2*F2
(Assuming D is the number of shares and F is the current price).
Drag the formula down to apply it to other rows.

For the Profit/Loss column, subtract the purchase price from the current price and multiply by the number of shares:
Enter the formula in the Profit/Loss column:
=(F2-E2)*D2
(Where E is the purchase price, F is the current price, and D is the shares owned).
Drag the formula down to apply it across the spreadsheet.

Step 5: Use Conditional Formatting for Profit/Loss
You can use conditional formatting to set colors for profit and loss. First, select the range, then click Format > Conditional formatting. Choose Less than under Format Cells. If so, then type 0 in the value field. Now, you can choose the color to easily see if the value on the Profit/Loss column is “Loss.”

Now that your portfolio tracker is set up, keep it updated regularly. Manually input new investments, prices, or dividends to stay on top of your portfolio’s performance.
With data validation in place, you’ll minimize errors, and the automated formulas will save you from manual calculations.
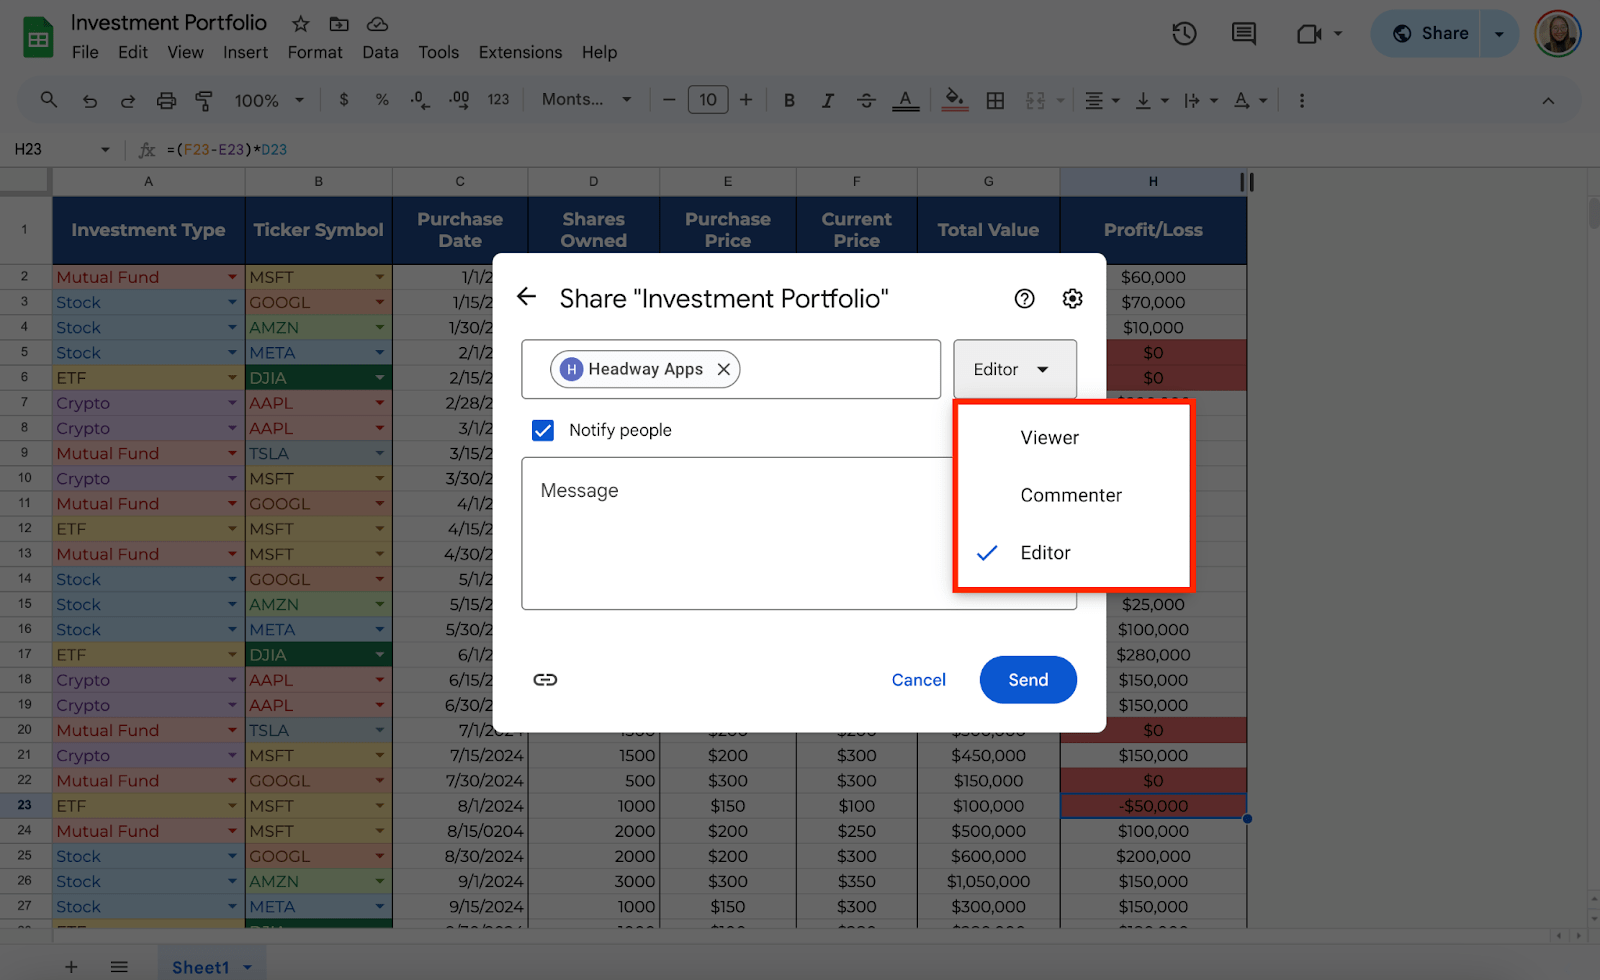
You can also share this template with anyone you prefer. Click the “Share” button and enter their email address.
Step 7: Use Google Finance for Live Data (Optional)
You can take your Google Sheets portfolio tracker to the next level by pulling livestock prices using the Google Finance function:
In the Current Price column, enter the formula:
=GOOGLEFINANCE(B2, “price”)
(Where B is the ticker symbol column).
Google Sheets will automatically pull the live price of your stock, saving you time and keeping your tracker updated in real time.

Get the Free Investment Portfolio Template
Get a copy of the Free Investment Portfolio template. I’ve already populated some cells, but you can customize them as needed.
Final Thoughts
I like how easy it is to customize this tool for my specific needs, and I hope it’ll be just as helpful for you. Keeping things simple and automated allows me to focus more on the bigger picture rather than getting lost in the details. Give it a try and see how it can work for you!
Frequently Asked Questions
How can I track the purchase date of each investment while ensuring the format is correct?
You can validate the date format by selecting the column for Purchase Date, going to Data > Data Validation, and choosing Date under the Criteria section. You can also set date ranges, which ensures all dates are correctly formatted and within the specified range.
Is there a way to automate the calculation of dividends in my portfolio?
You can track dividends by adding a separate Dividends column and entering the dividend per share. Multiply the dividend by the number of shares to get the total dividend using the formula:
=F2*D2 (Where F is the dividend per share, and D is the number of shares owned). You can manually update dividends or add them periodically.
How do I handle stock splits in my portfolio tracker?
When a stock split occurs, you can adjust the number of shares and the purchase price accordingly. For example, if you held 100 shares and a 2-for-1 split occurs, you’ll now own 200 shares at half the original price. Manually update the Shares Owned and Purchase Price columns to reflect the split.
The Bottom Line:
One keeps you awake. The other gets work done.
A month of coffee: $80
A month of FileDrop: $19
Why not have both?


